

A heat map lets you view in real time, by wireless frequency band, the signal strength and wireless coverage for a building floor. The heat map shows the actual signal strengths that each access point is detecting from neighbor access points.
Note:For the heat maps to work correctly, the access point placement on the floor plan needs to closely match the actual physical location of the access points.
The heat map shows the following information:
- Signal strength and wireless coverage, including coverage holes
- Known access points that are managed by the wireless controller
- Location of rogue access points
- Location of clients associated with the access points
- Location of blacklisted clients
»To view the heat map for a building floor and to adjust access points:
- Select Plans > Deployed. The Deployed Buildings screen displays with the Local Building tab and associated screen in view. To view the information for a remote building, click the Remote Building tab.

The Deployed Buildings screen shows a tab for each building that you previously defined. For each building, the screens shows the floors that you previously defined. - Select the building and floor for which you want to view the heat map by clicking the corresponding tabs.
-
Click Heat Map. The heat map for the selected floor displays:.
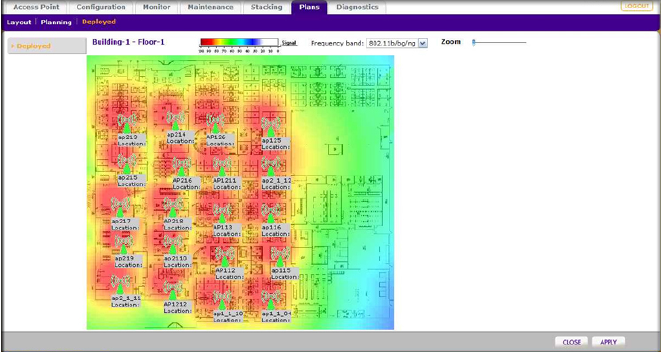
- The first time you view the heat map, the access points need to be manually placed on the heat map to closely match their actual physical locations.
-
Click Apply to save the locations. Doing so regenerates the complete heat map of the floor.
The spectrum bar at the top of the screen indicates how the colors correspond to the signal strength and wireless coverage.
To view information about an access point or client on the heat map, place your pointer over the icon. The following information becomes available:- IP address
- MAC address
- Name
- Model
- Status
- Power per channel
- Configured and operating channel bandwidth
To select another wireless frequency band, make a selection from the Frequency band drop-down list above the heat map.
Use the Zoom slider to increase or decrease the size of the map. - Make adjustments to the wireless signal strength and coverage in real time by dragging the access point icons to new locations.
The colors disappear from the heat map until you click Apply again. When you apply the new position, the heat map is refreshed based on the new location and the RF data collected from the access points. - Click Apply to view how your changes affect the heat map. Depending on the size of your WLAN, it might take several minutes before the heat map is updated. If you do not want to apply the changes, click Close to return to the Deployed Buildings screen.