

The ReadyNAS provides status graphics for volume throughput, network throughput, volume utilization, and system temperatures.
Note: Status graphics are not supported for ReadyNAS 102, 104, 202, 204 and 2120 systems.
To display and configure the system status graphics:
- Select System > Performance.
- Scroll down to Volume, Network, Utilization, or Temperature to view the corresponding status graphics.
The following sections describe the information displayed on these status graphics.
Volume
The Volume throughput graphic shows the number of read and write operations per second.
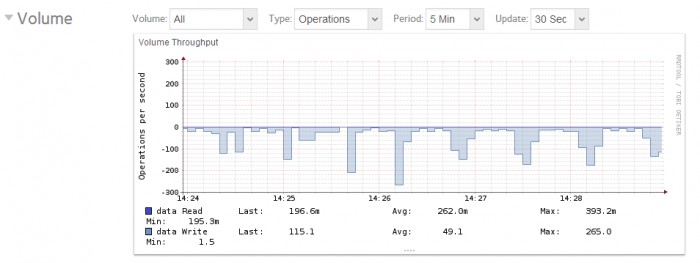
The range is flexible and depends on your selections from the drop-down lists above the graphic. For example, the range can be from 0 to 200 operations. The upper part of the graphic indicates the number of read operations (indicated by positive numbers). The lower part of the graphic indicates the number of write operations (indicated by negative numbers).
From the drop-down lists above the graphic, you can adjust the following settings:
- Volume. Select all volumes or individual volumes.
- Type. Select the number of operations per second or the bandwidth consumed per second.
- Period. Select the period over which the operations or bandwidth is measured. You can select from 5 minutes to 1 year.
- Update. Select how often the information in the graphic is updated. You can select from 30 seconds to 5 minutes.
Network
The Network throughput graphic shows the network usage for Tx and Rx traffic in bytes per second.
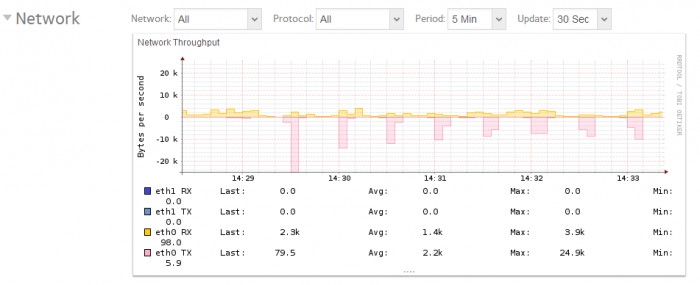
The range is flexible and depends on your selections from the drop-down lists above the graphic. For example, the range can be 0 to 60 bytes or from 0 to 40 KB. The upper part of the graphic indicates the incoming (Rx) traffic; the lower part of the graphic indicates the outgoing (Tx) traffic.
From the drop-down lists above the graphic, you can adjust the following settings:
- Network. Select all network interfaces, individual interfaces, or individual bonds.
- Protocol. Select all protocols or individual protocols (SMB, NFS, AFP, HTTP, HTTPS, SSH, iSCSI, or SMTP).
- Period. Select the period over which the network usage is measured. You can select from 5 minutes to 1 year.
- Update. Select how often the information in the table is updated. You can select from 30 seconds to 5 minutes.
Utilization
The Volume utilization graphic shows the percentage of used storage space for an individual volume or for all volumes. The range is from 0 to 100 percent.
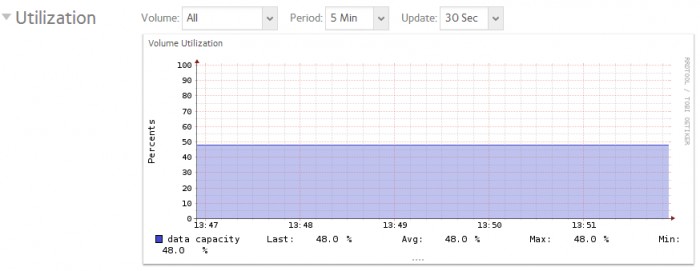
From the drop-down lists above the graphic, you can adjust the following settings:
- Volume. Select all volumes or individual volumes.
- Period. Select the period over which the utilization is measured. You can select from 5 minutes to 1 year.
- Update. Select how often the information in the table is updated. You can select from 30 seconds to 5 minutes.
Temperature
The Temperature graphic shows the system temperatures in degrees Celsius.
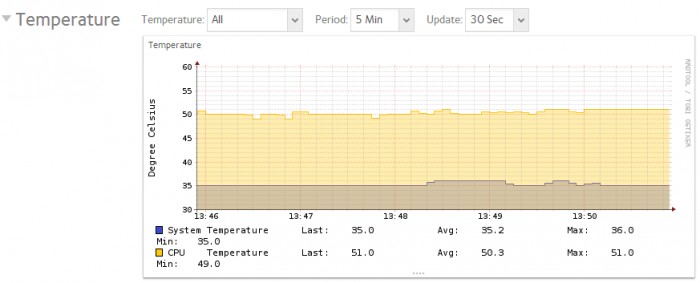
The range is flexible and depends on your selections from the drop-down lists above the graphic and the temperatures that are measured. For example, the range can be from 0 to 50 degrees Celsius.
From the drop-down lists above the graphic, you can adjust the following settings:
- Temperature. Select all temperatures, the system (SYS) temperature, the CPU temperature, or the auxiliary (AUX) temperature.
- Period. Select the period over which the temperatures are measured. You can select from 5 minutes to 1 year.
- Update. Select how often the information in the table is updated. You can select from 30 seconds to 5 minutes.